SELECTED PROJECTS
|
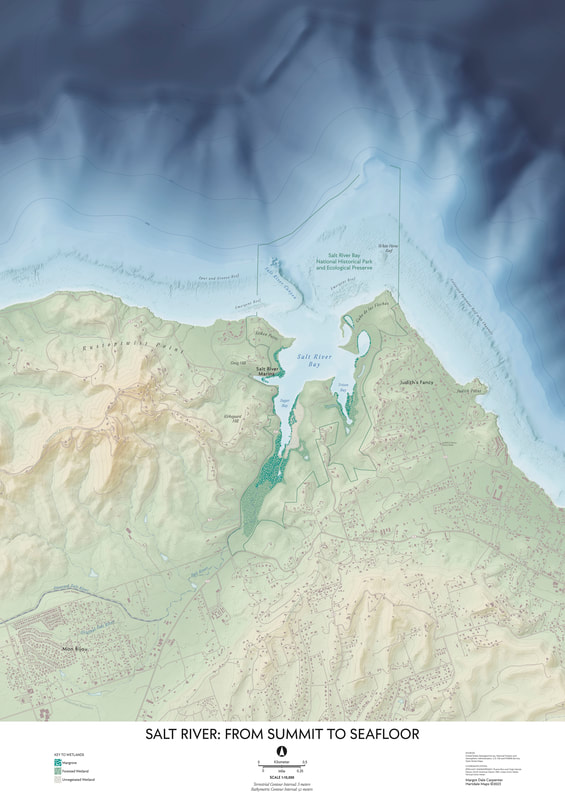
SALT RIVER: FROM SUMMIT TO SEAFLOOR Presented at the International Cartographic Association, 12th Mountain Cartography Workshop, Salt River: From Summit to Seafloor explores workflows that connect disparate deepwater, topobathy, terrestrial and wetland datasets to create a cohesive shaded relief map of St. Croix’s Salt River. 24” x 34”. 2023. |
|
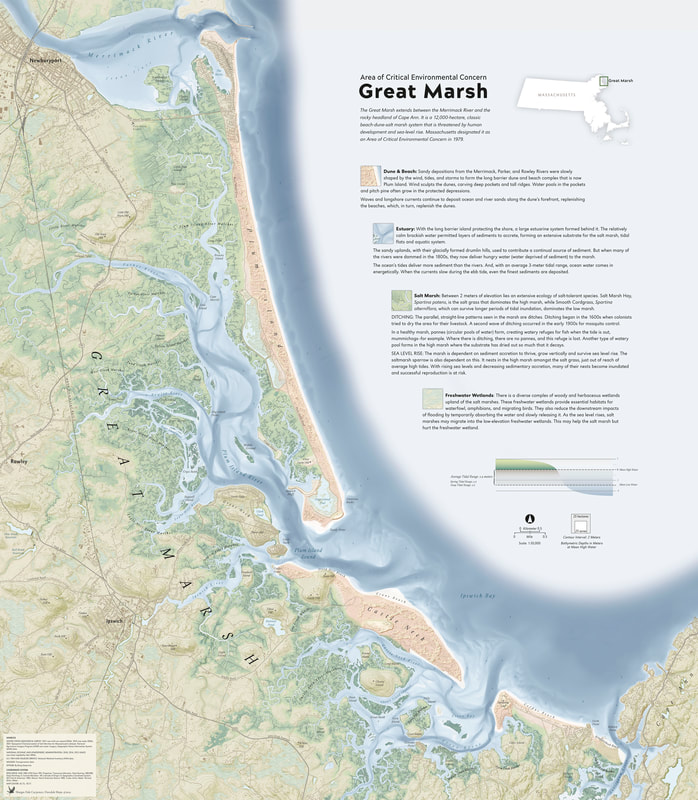
GREAT MARSH Leveraging USGS’s high-resolution elevation data to depict Massachusetts’ Great Marsh reveals the historic and destructive ditching of the expansive salt marsh. The barrier beach/dune complex of Plum Island and the high-energy estuary’s deposition patterns provide context. 24” x 28”. 2022. > 50th annual CaGIS Map Design Competition, Reference Map Category, Honorable Mention. |
|
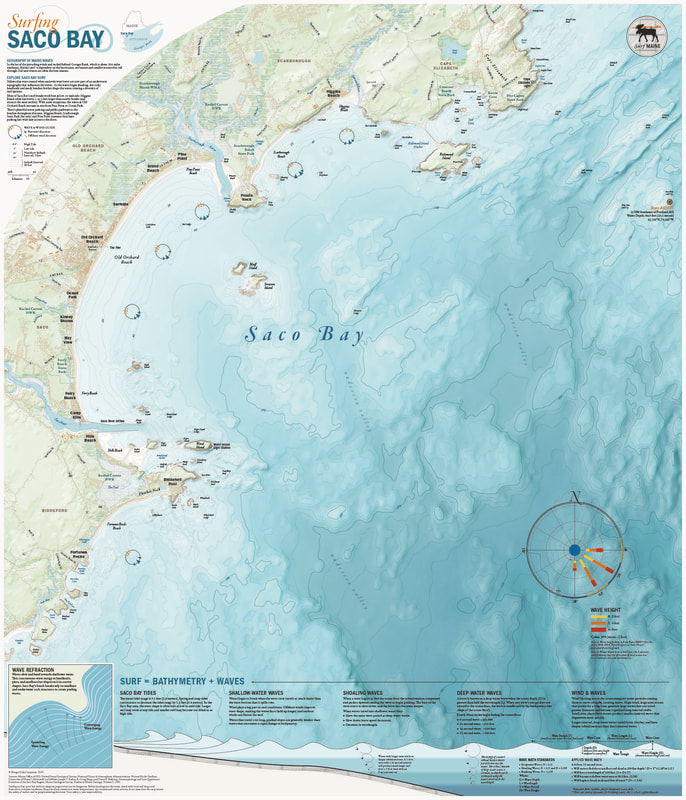
SURFING SACO BAY Created from an abiding interest in describing the coastal environment and a love for surfing, Surfing Saco Bay dives into the dynamic connection between waves and bathymetry. 24” x 28”. 2019. > Avenza Map Competition Second-Place Winner > Published in Atlas of Design, Volume 5 |
|
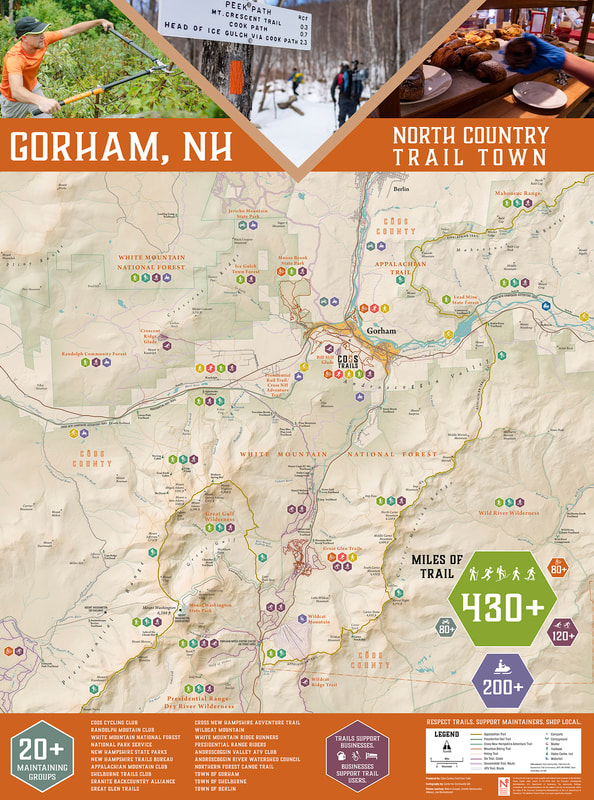
GORHAM, NH - NORTH COUNTRY TRAIL TOWN A Community Geographics bold poster highlighting the trails and outdoor destinations surrounding Gorham, NH. 24" x 36". 2021. |
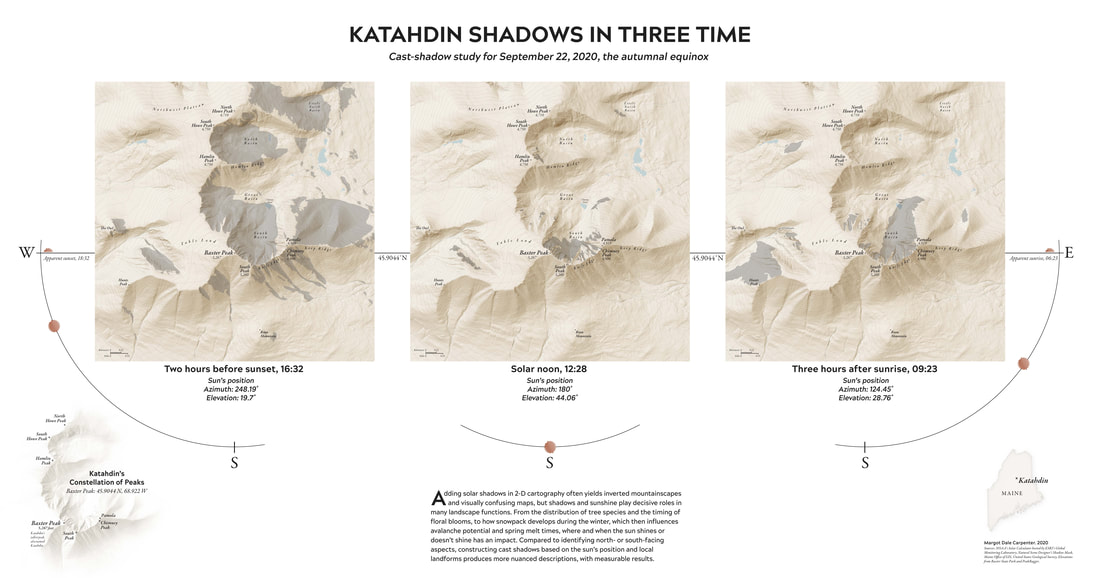
KATAHDIN SHADOWS IN THREE TIME. Displayed in the NACIS 2020 Annual Meeting virtual Map Gallery, this map explores a nuanced view of cast shadows. 30” x 16”. 2020.
|
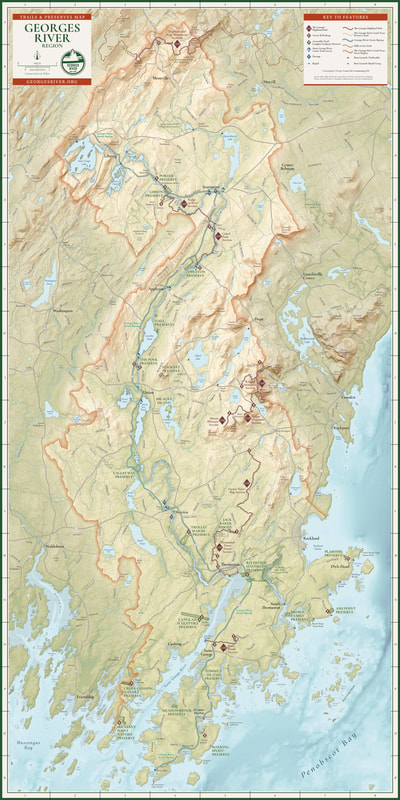
GEORGES RIVER REGION, TRAILS & PRESERVES The centerfold in a Community Geographics brochure detailing the trails and adventures in the Georges River watershed and coastal area for the Georges River Land Trust. 18" x 36". 2019. |
|
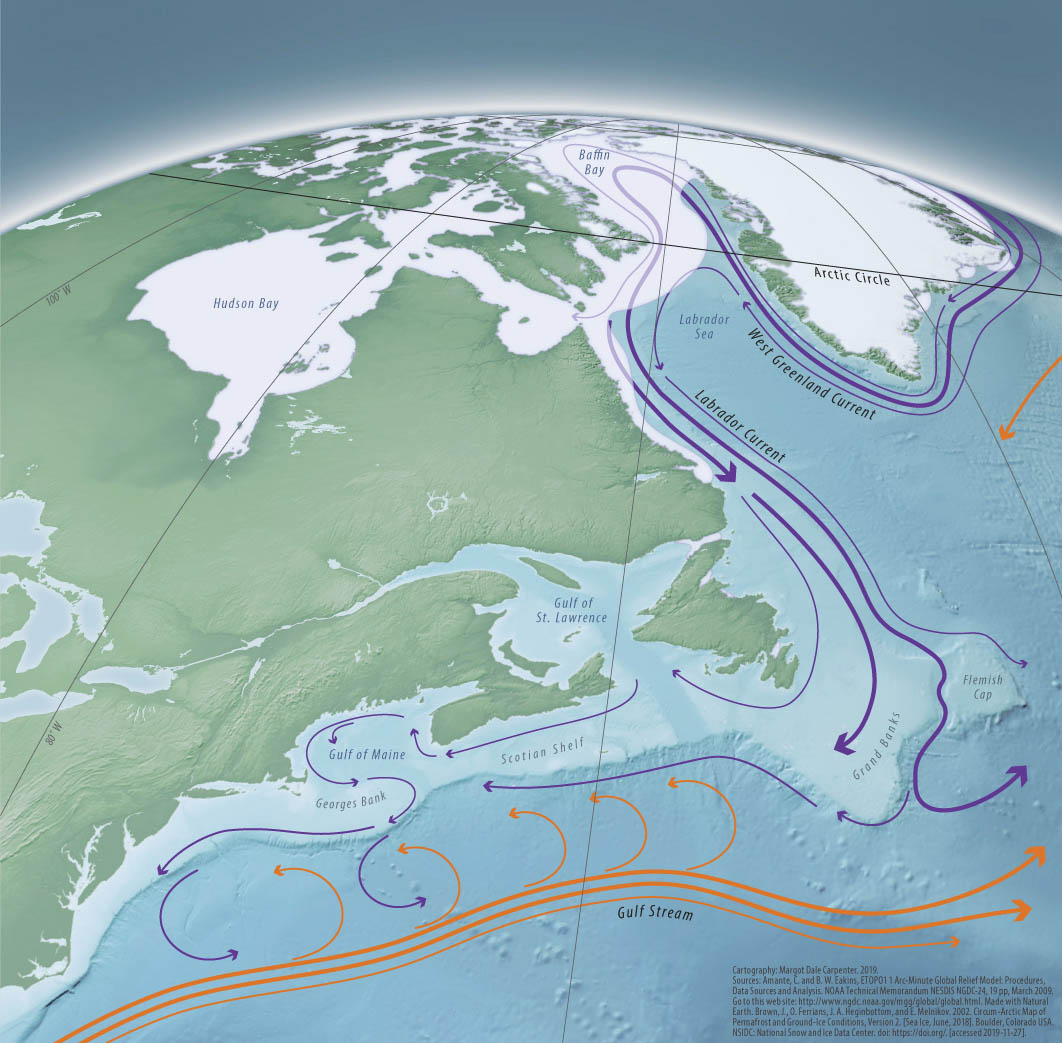
GULF OF MAINE, CLIMATE CHANGE Supporting the science that the Maine Sea Grant team coalesced into a dynamic and informative climate change report was the key here. The map was designed to evolve as the report developed, permitting additional text and graphics. See the final Maine's Climate Future 2020 Update HERE. Submitted map. 7” x 7”. 2019. |
|
NACIS MAP QUILT ENTRY
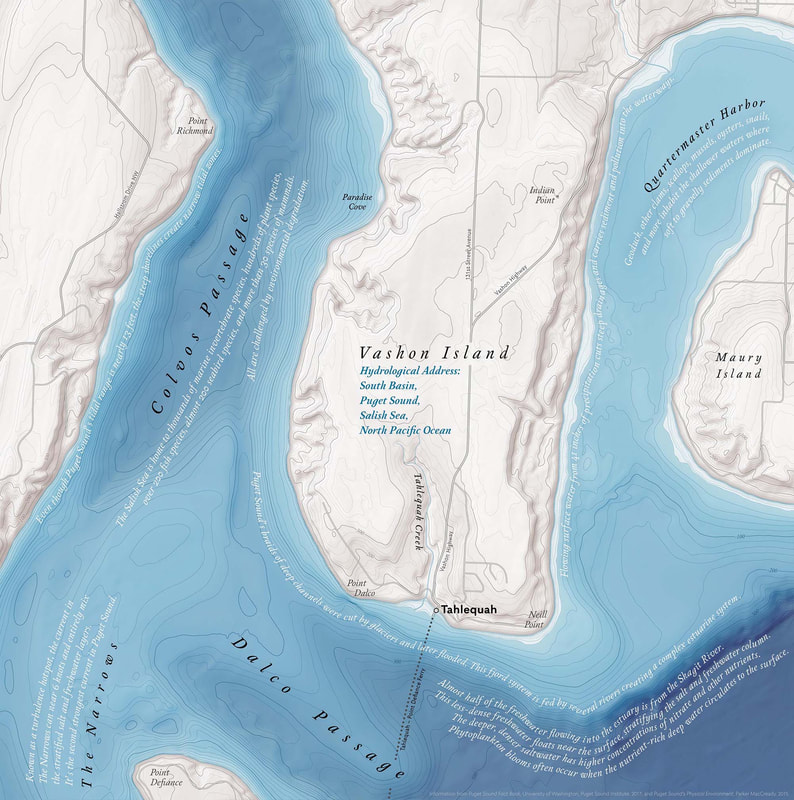
Participating in the annual NACIS conferences is a highlight of every year and when I had the opportunity to contribute to the NACIS Map Quilt 2019, I jumped on it. Twelve quilt sections were digitally sewn together to form a fun and thought-provoking map of Tacoma, Washington, the current-year’s conference location. 13” x 13”. 2019. |
|
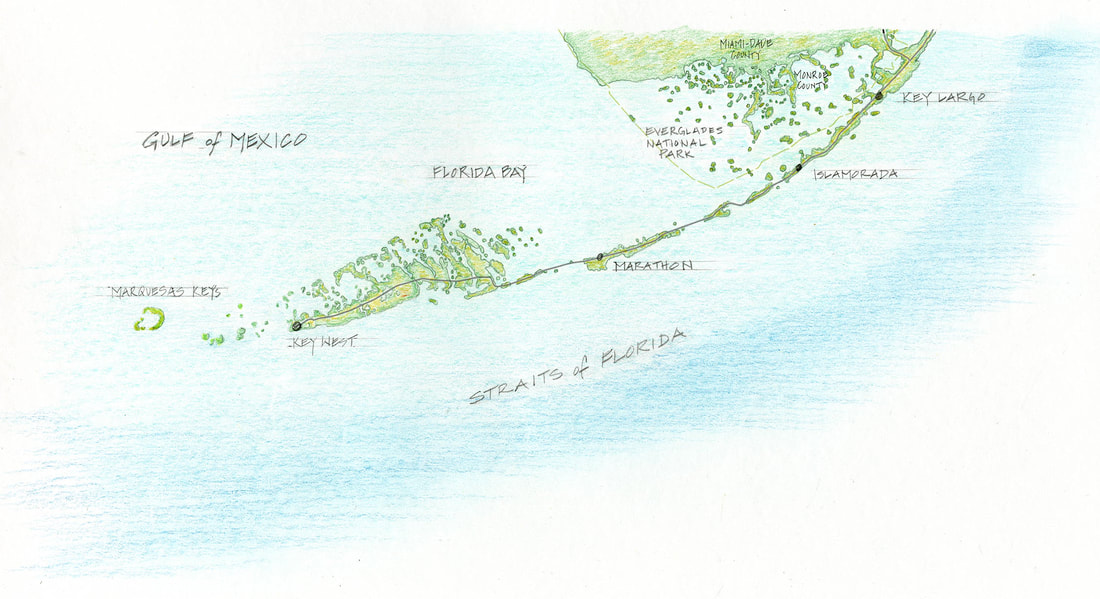
THE FLORIDA KEYS Created for an Island Journal article, “Whelmed in Key Largo, Florida Keys are vulnerable and much is at stake”, by Steven Harris, this hand-drawn map describes the vulnerability of the long and low-lying geography of the Keys. Island Journal, volume 35. 2019. |
|
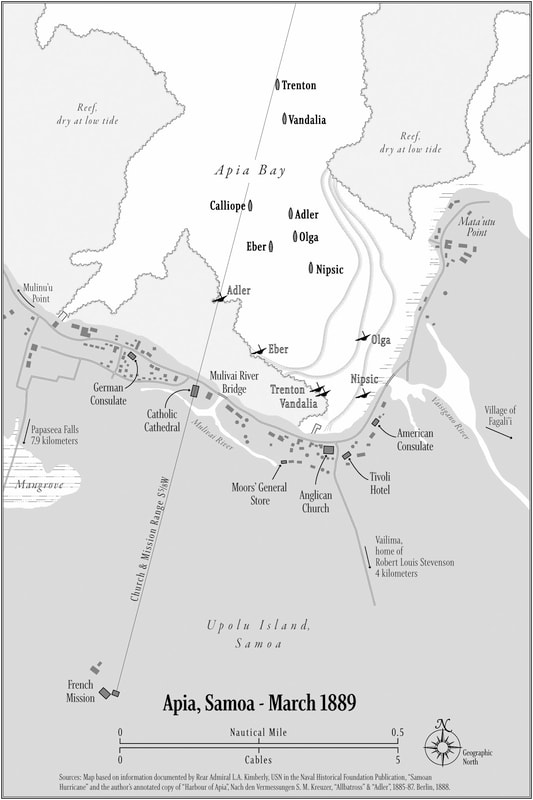
APIA, SAMOA - MARCH 1889 Created to support Walter Price’s upcoming book about the 1889 Apia Cyclone that decimated both American and British naval ships moored in Apia Harbor. 4.5" x 6.75". 2019. |
|
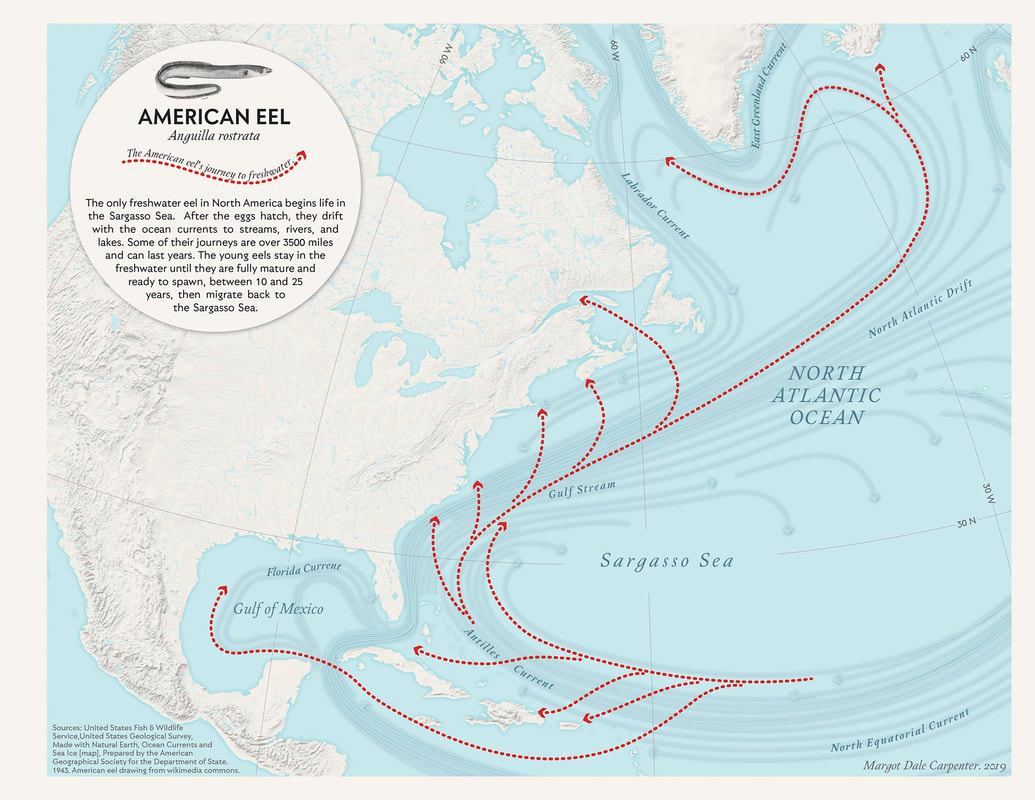
AMERICAN EEL A fun and fast map for Guerilla Cartography’s Atlas in a Day: Migration project. The theme was announced at 9:00pm PST and the final map delivered at 7:30pm PST, 24 hours to research, design and print. See Guerrilla Cartography’s website HERE for the final atlas. 2019 |

|
COASTAL WATER - CARTOGRAPHIC STUDY SKETCHES Representing coastal waters is an abiding passion and I compiled these thumbnail studies to capture the variety of techniques used throughout history. Surface waters and bathymetric styles are detailed in pen and colored pencil. 8” x 22”. 2018. |
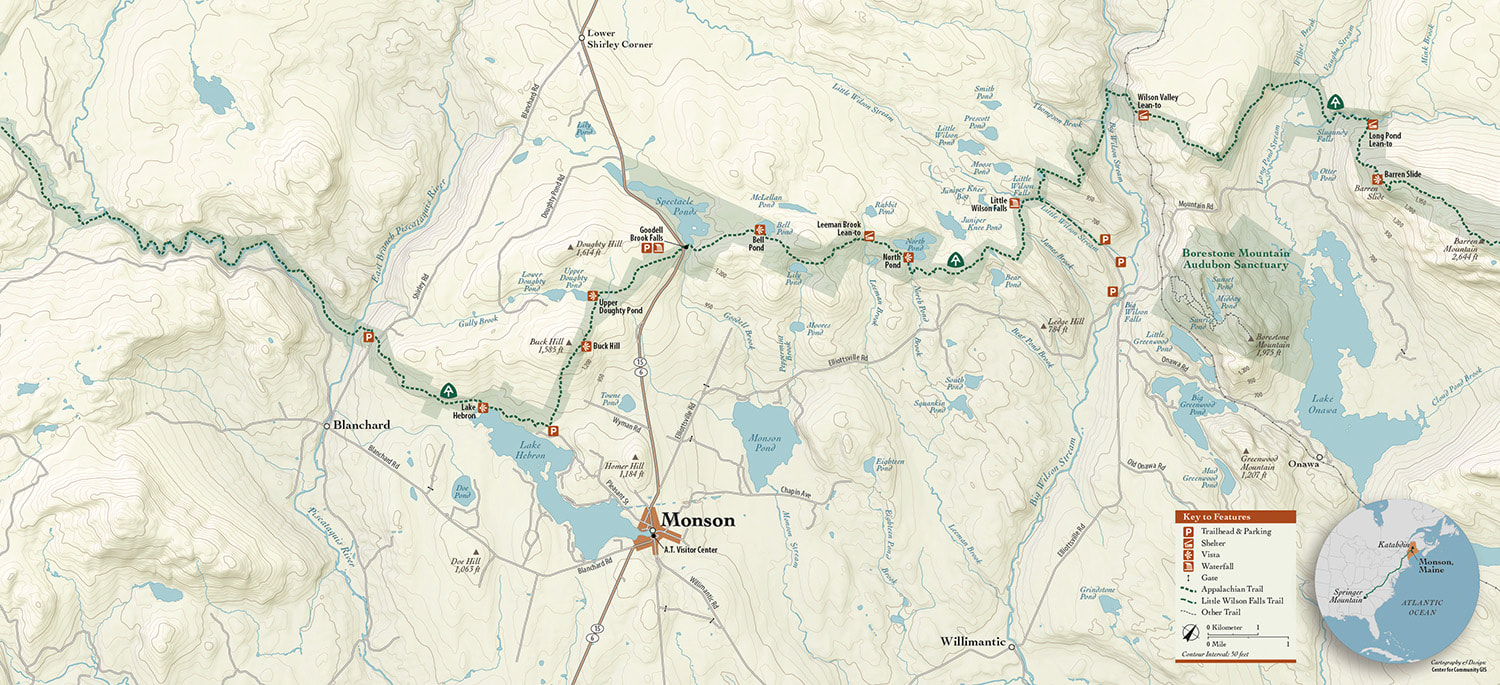
APPALACHIAN TRAIL - MONSON, MAINE
Created for the Monson Appalachian Trail Visitor Center with Community Geographics as part of a day-hike focused brochure. The final brochure includes a cover on the left panel. 2018.
Created for the Monson Appalachian Trail Visitor Center with Community Geographics as part of a day-hike focused brochure. The final brochure includes a cover on the left panel. 2018.
|
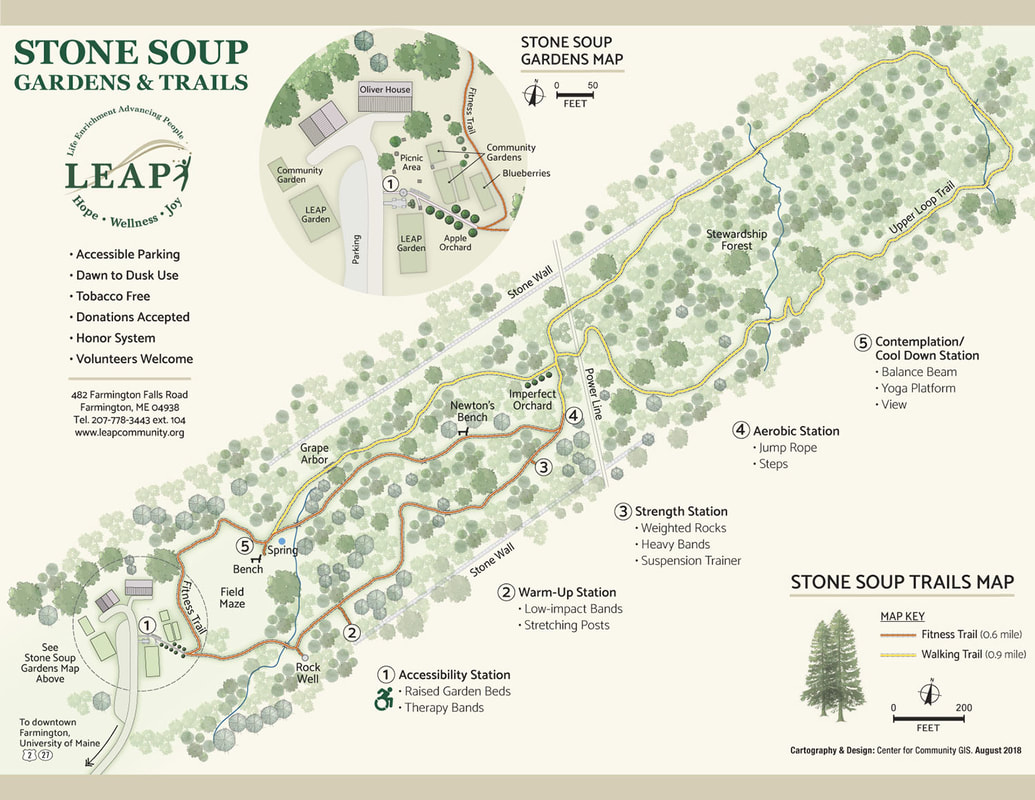
STONE SOUP, GARDENS & TRAILS
A letter-sized map for a hard-working project. Created with Community Geographics. 2018.
A letter-sized map for a hard-working project. Created with Community Geographics. 2018.
|
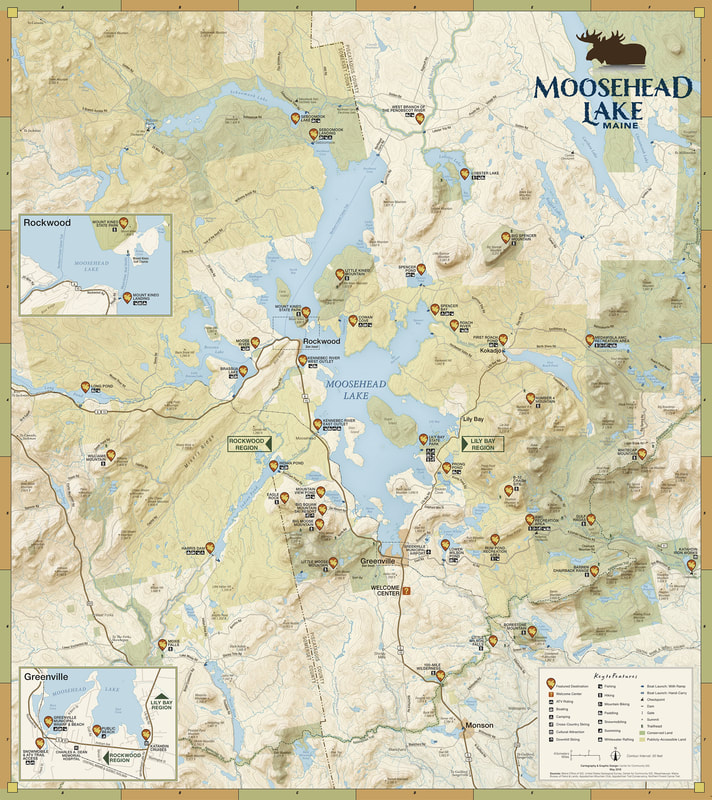
MOOSEHEAD LAKE, MAINE With Community Geographics, this map was created as part of a package highlighting the Moosehead Lake area. 2018 |
|
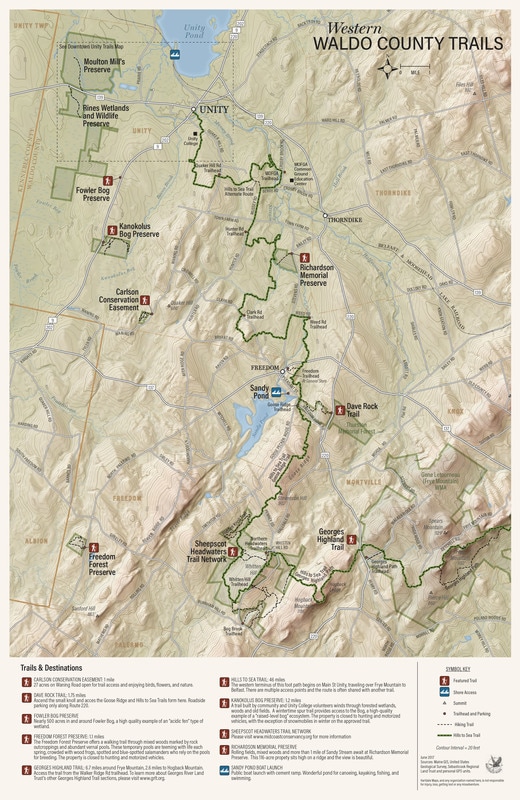
WESTERN WALDO COUNTY TRAILS Bringing attention to western Waldo County's trails and landscape. 2017. |
|
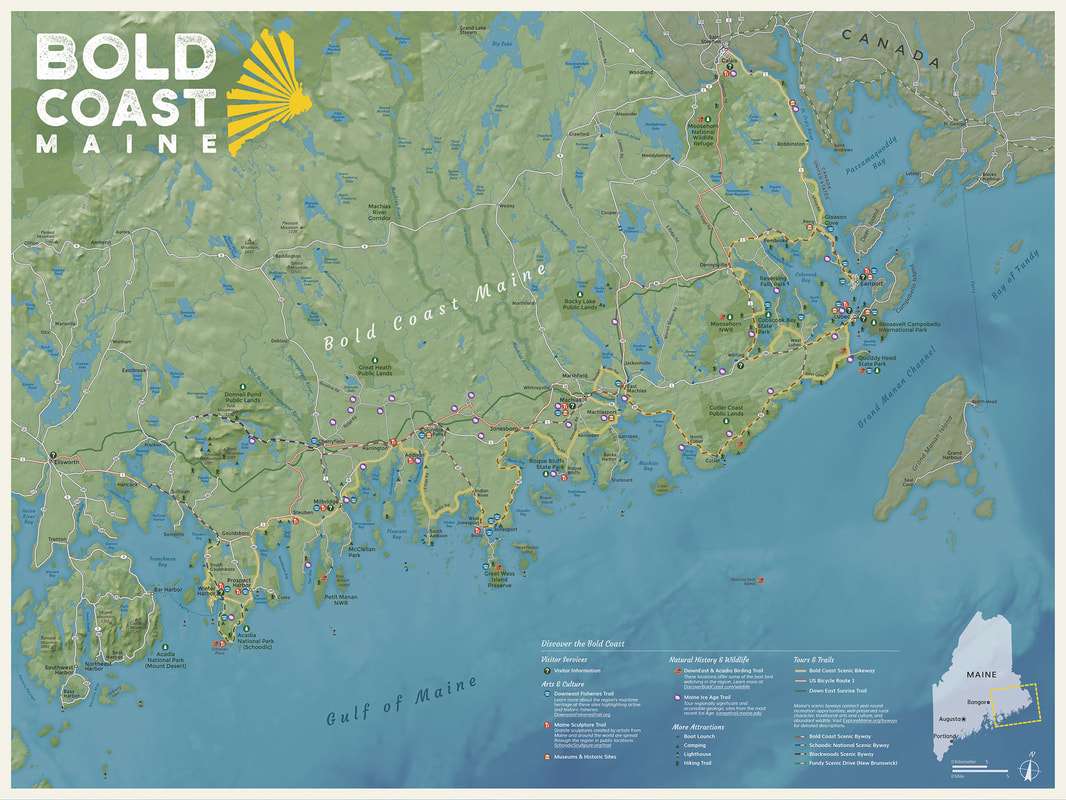
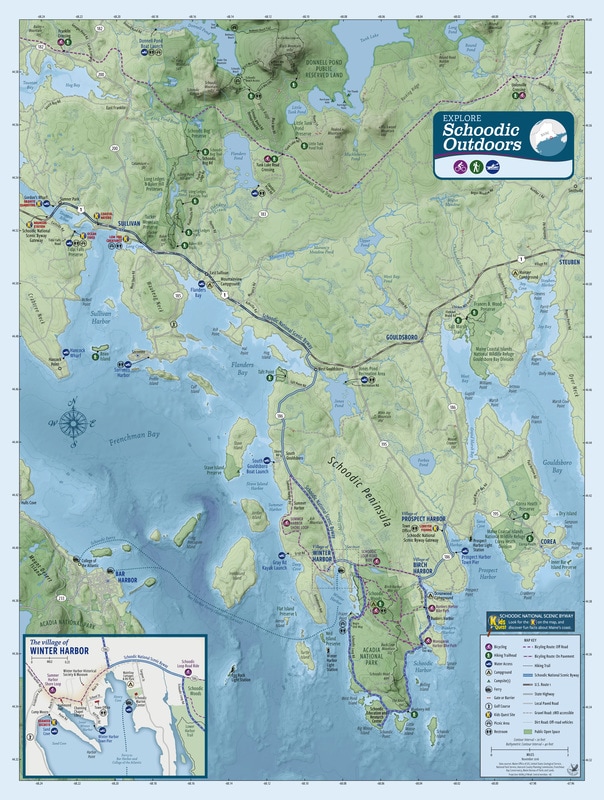
EXPLORE SCHOODIC OUTDOORS Part of a brochure inviting people to cycle, hike and paddle the Schoodic Peninsula area. 2016-17. |
|
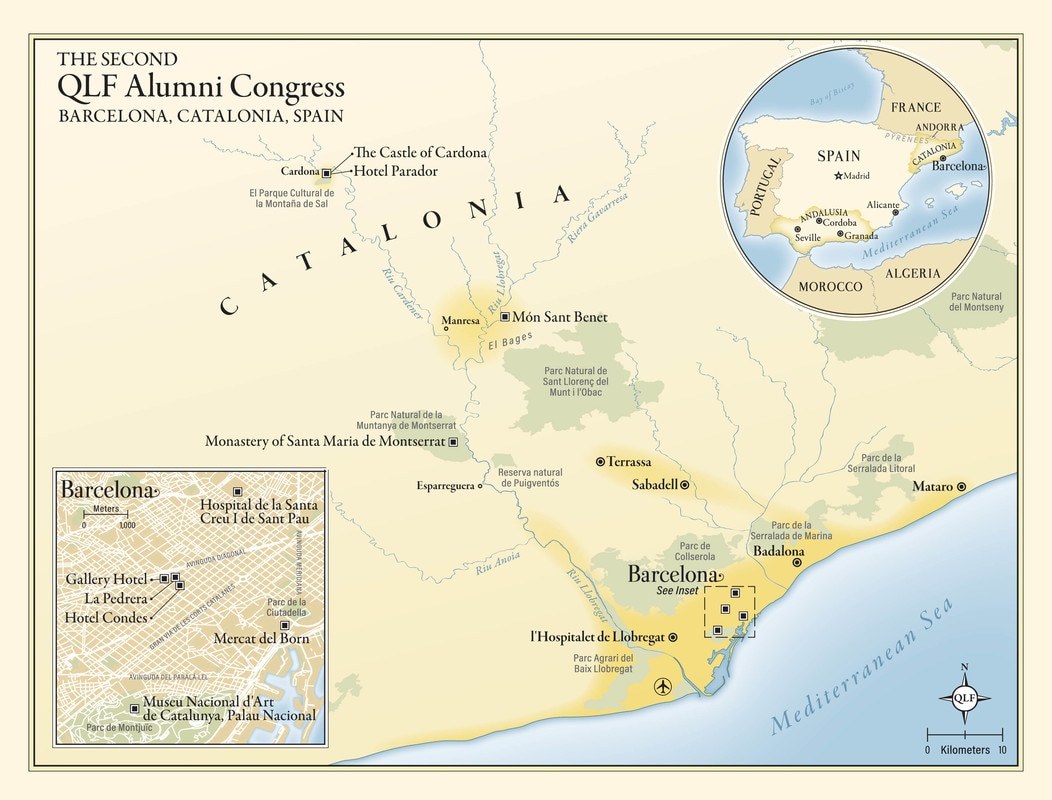
THE SECOND QLF ALUMNI CONGRESS, BARCELONA, CATALONIA, SPAIN Highlighting the destinations of the Quebec-Labrador Foundation second congress, this map was created in color and greyscale versions for the website and printed media. 2016. |
|
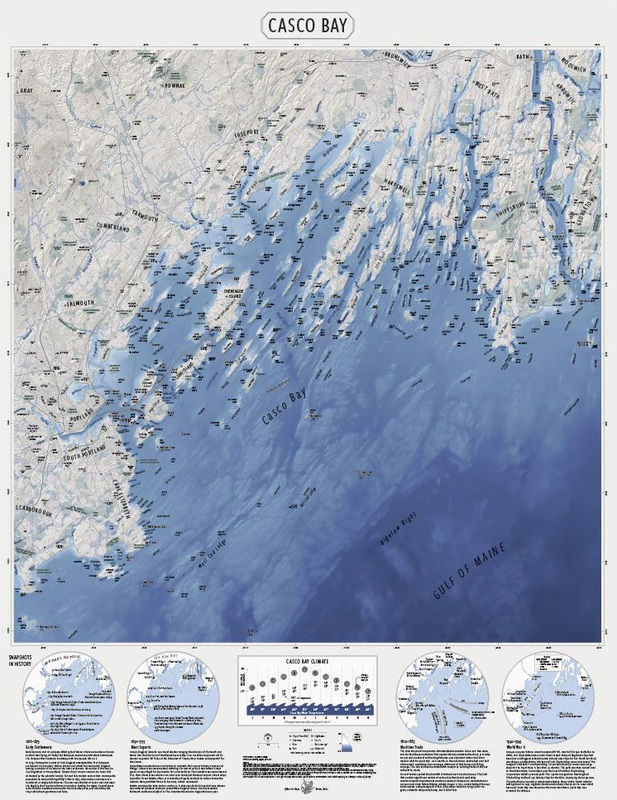
CASCO BAY This map’s rich layers of blues display Casco Bay's bathymetry in clear and accurate detail. Underwater structures, from the very large West Cod Bank to Witch Rock, are easy to see. Four additional maps diagram significant historical events that have shaped Casco Bay's development and give many place names historical context. Shipwreck positions, lighthouse locations, and Casco Bay's climate are also identified. This large map is at a scale of 1:75,000, is 26"x34", and is suitable for framing. Buy it online at: Archipelago, The The Island Institute Store And, at these stores: Archipelago, The Island Institute Store 386 Main St., Rockland, ME 04841 207.596.0701 Hamilton Marine Portland 100 Fore St., Portland, ME 04101 207.774.1772 |
|
|
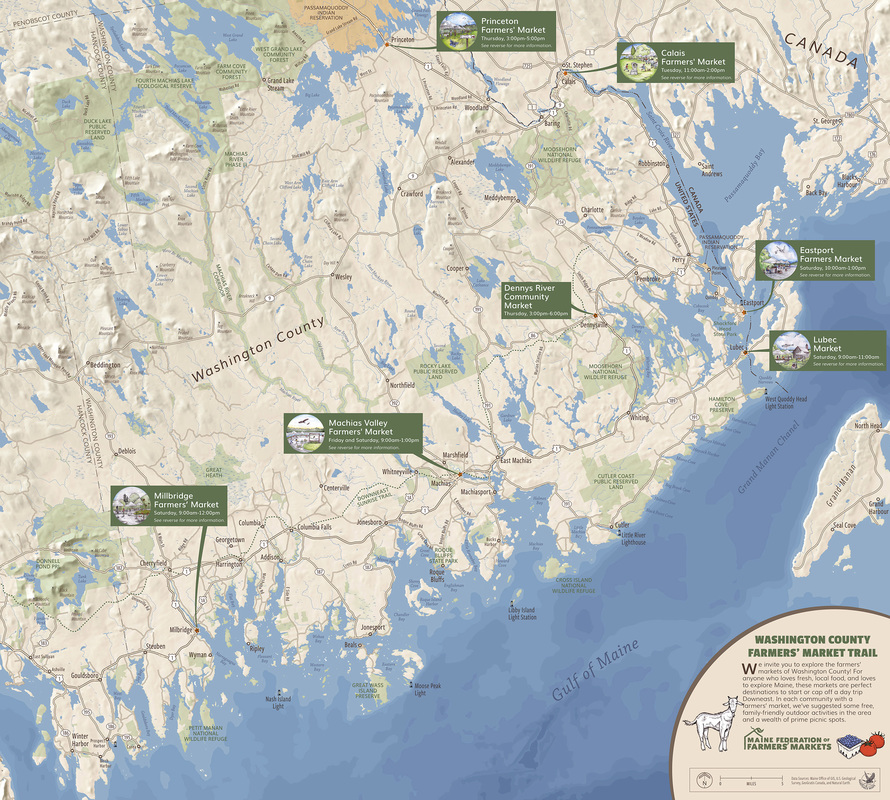
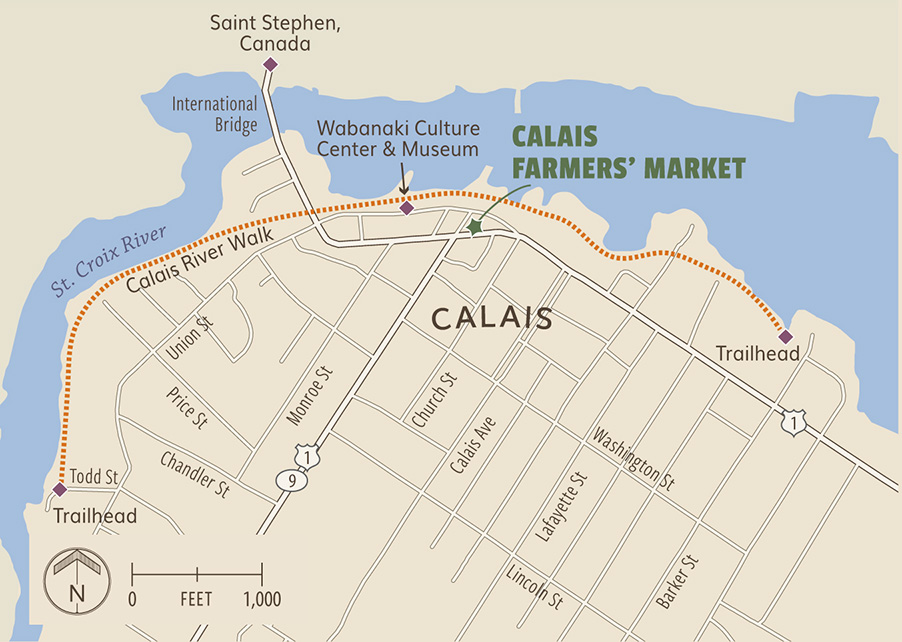
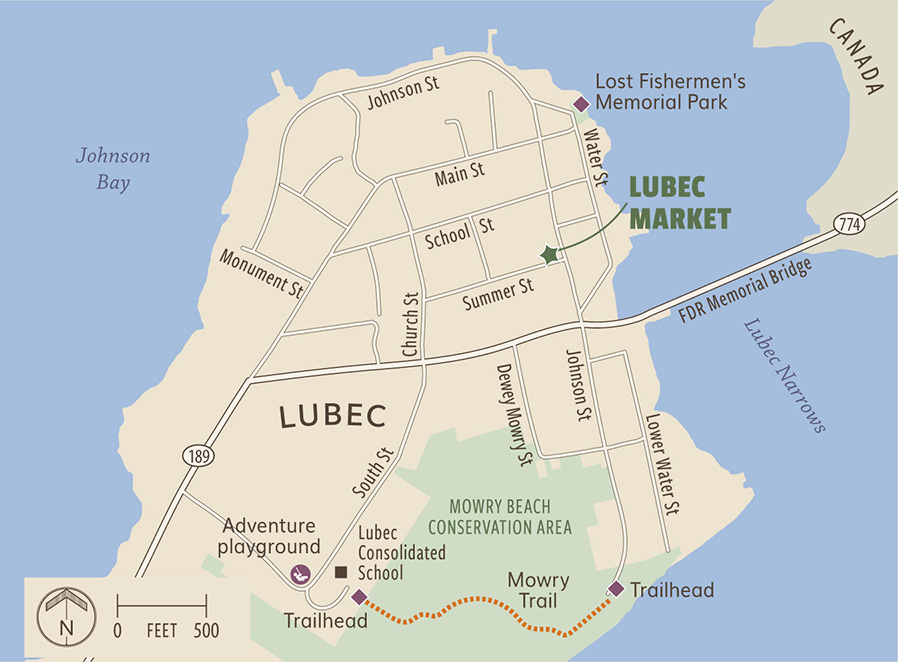
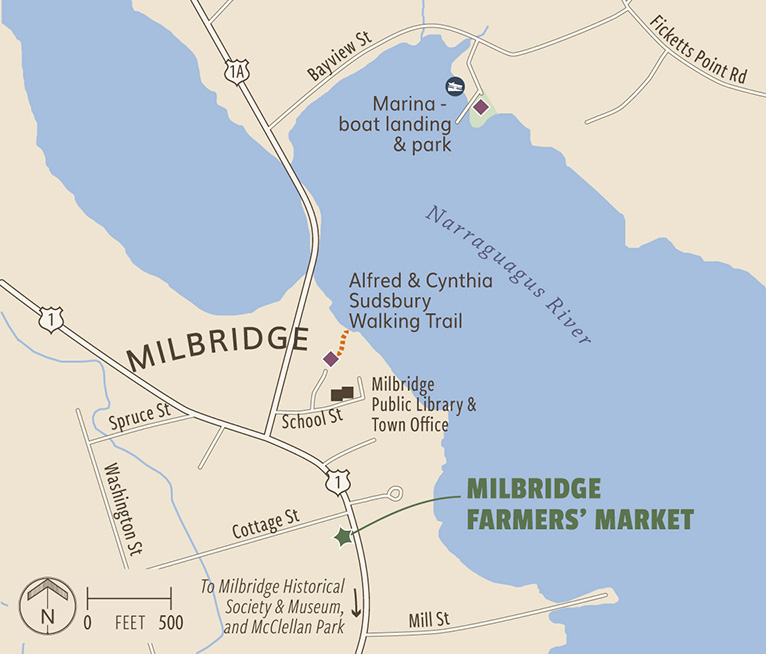
WASHINGTON COUNTY FARMERS' MARKET TRAIL
These maps are part of their new brochure. The large one describes the markets' locations and the landscape; and the mini-maps accompany descriptions for each locale. See their website for the complete brochure.
Maine Federation of Farmers' Markets
These maps are part of their new brochure. The large one describes the markets' locations and the landscape; and the mini-maps accompany descriptions for each locale. See their website for the complete brochure.
Maine Federation of Farmers' Markets

|
|
|
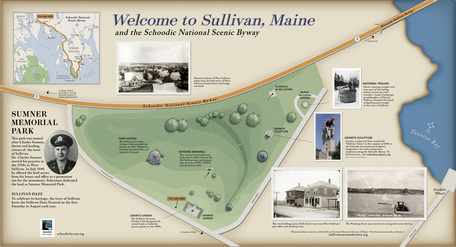
SUMNER MEMORIAL PARK.
Hartdale Maps created the maps for the Maine Department of Transportation's Schoodic National Scenic Byway Sumner Memorial Park panel. 2015. |
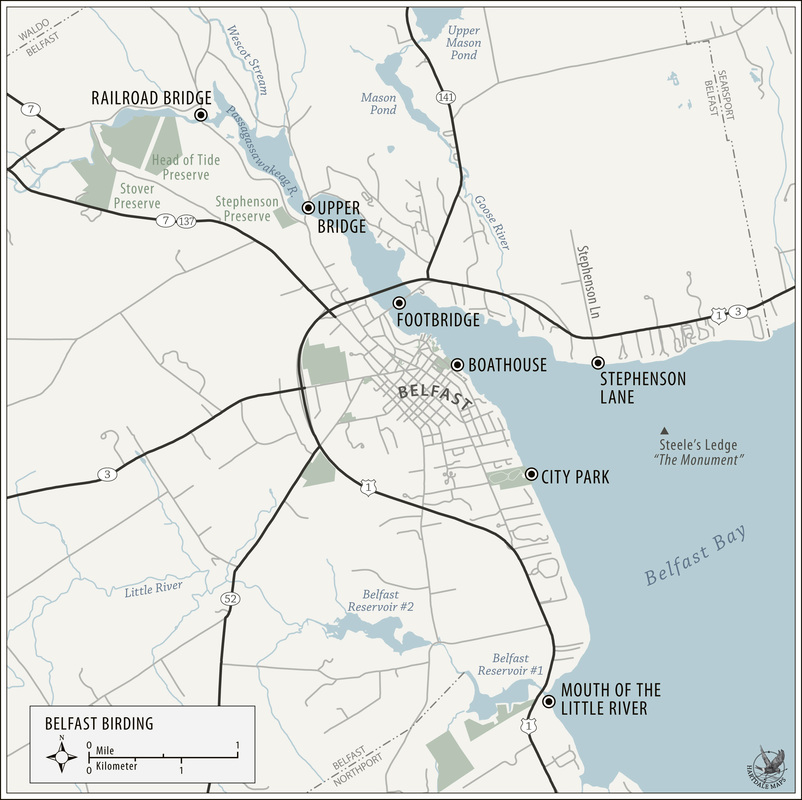
BELFAST BIRDING. 2015.
|
|
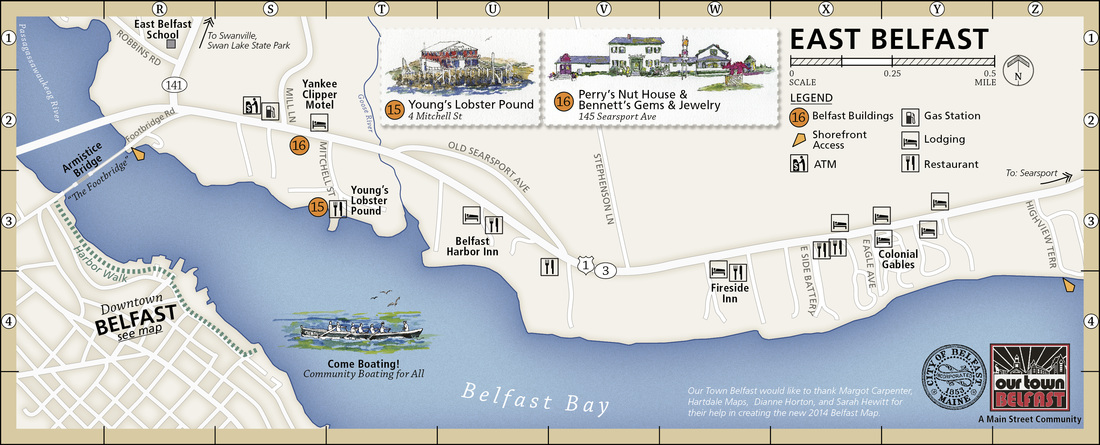
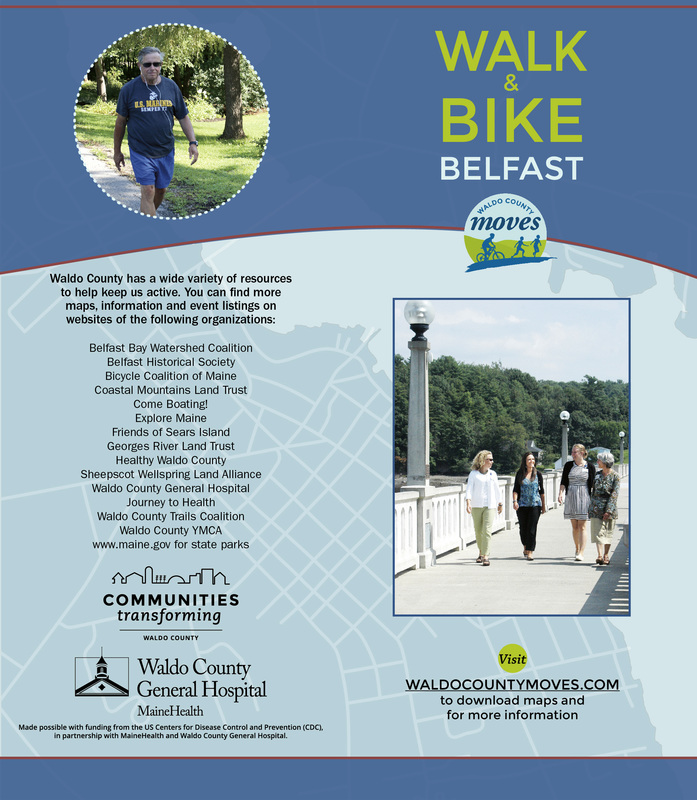
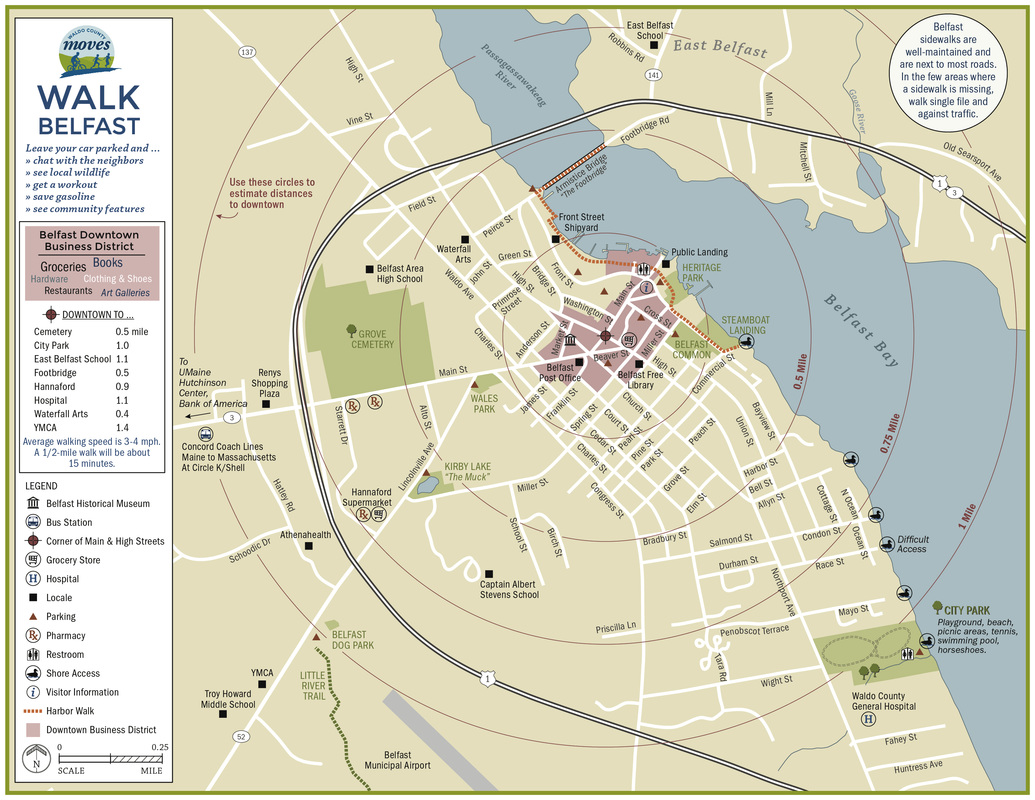
WALK & BIKE BELFAST. 2014.
|
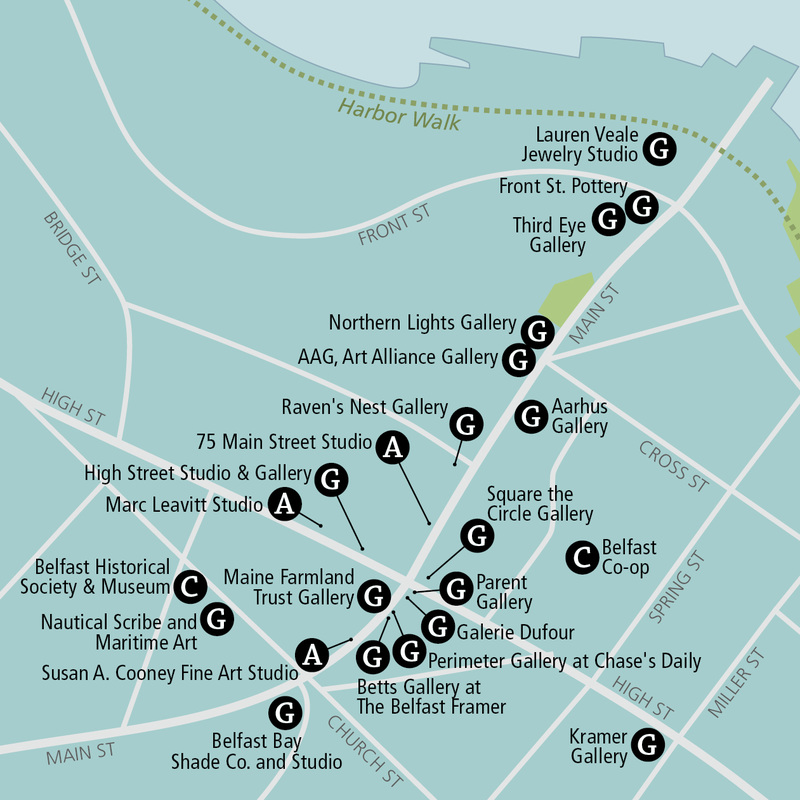
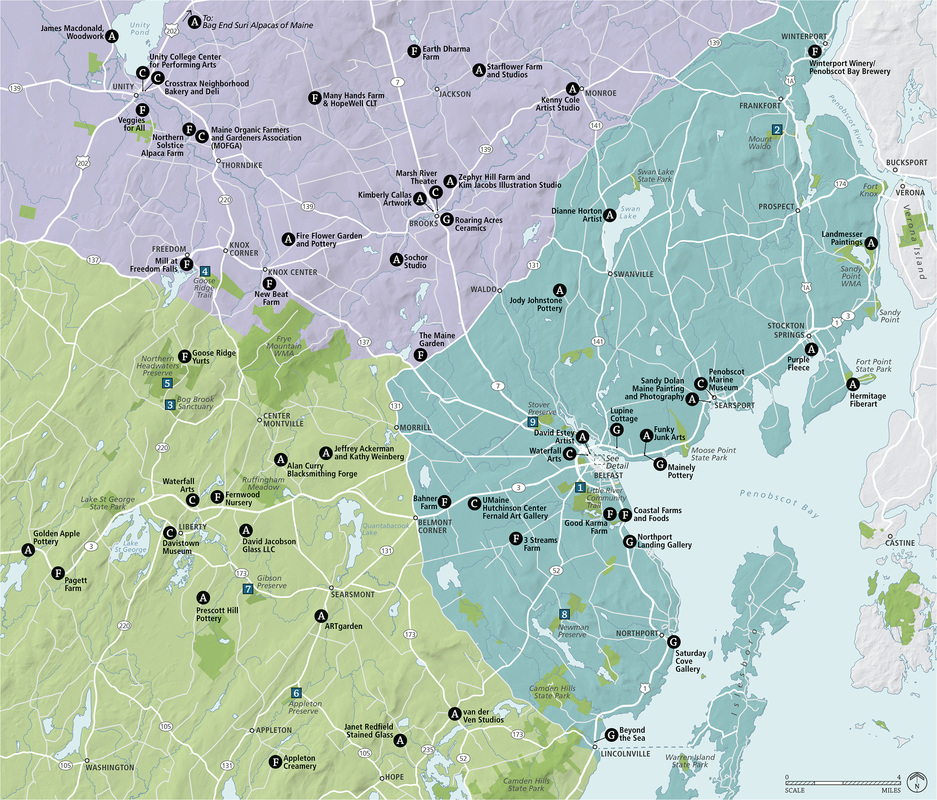
CULTIVATE FALL TOUR
Collaborating with artist Kimberly Callas and graphic designer Susan Dansereau to create this map for the Belfast Creative Coalition's annual Cultivate Fall Tour website and brochure made for dynamic production. 2014. Cultivate Fall Tour |
|
|
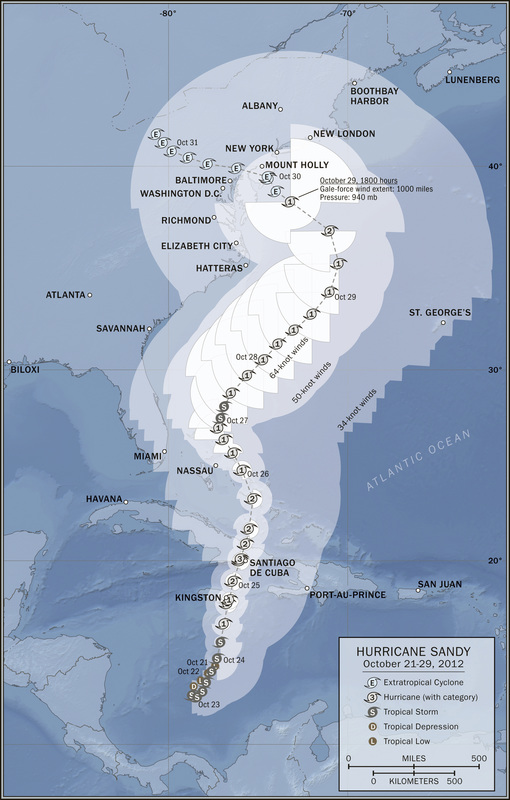
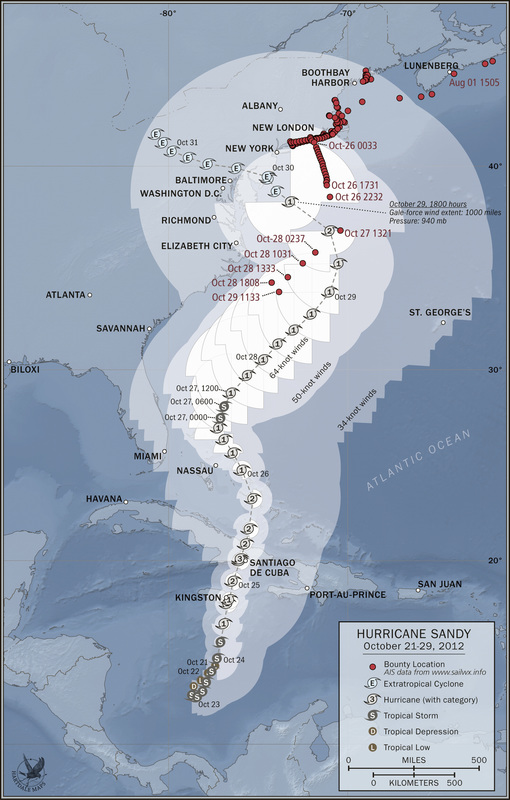
HURRICANE SANDY, OCTOBER 21-29 and HURRICANE SANDY WITH THE BOUNTY
On October 27, 2012, Hurricane Sandy was downgraded to a tropical storm and forecast to weaken. With that information, the Bounty changed course heading closer to shore. It was a fatal decision. The map on the left details the path of the storm, and the map on the right adds the Bounty's course. 2014. Superstorm |
|
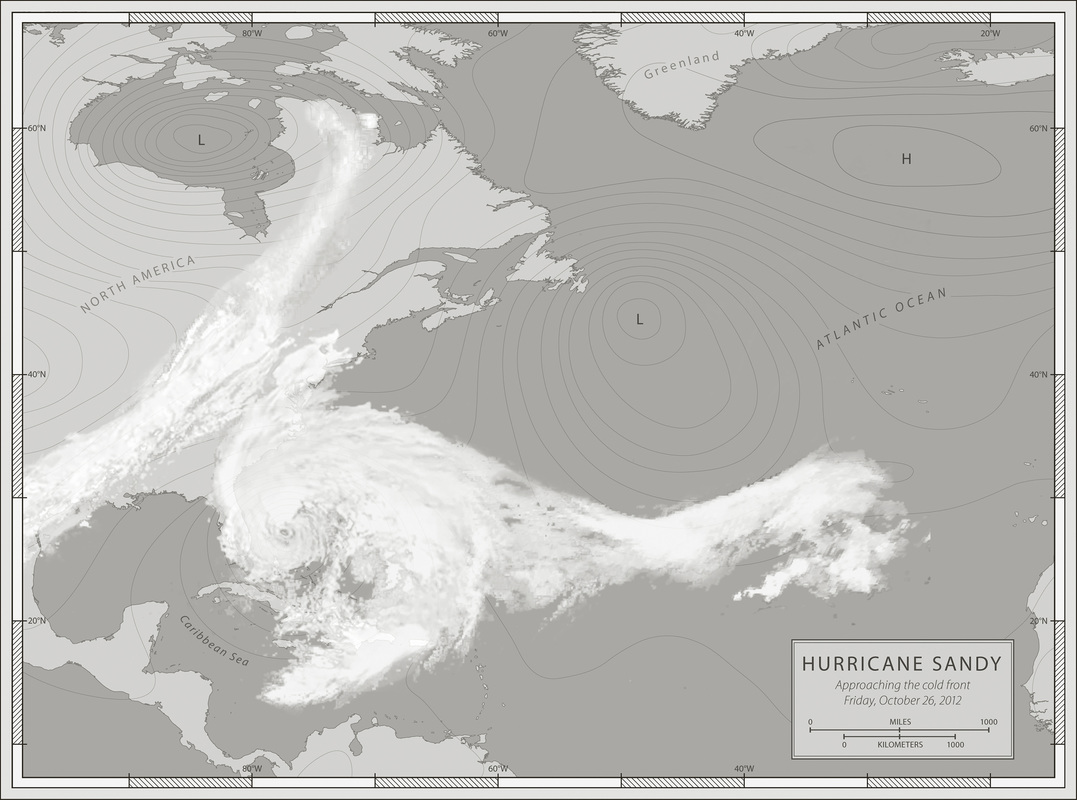
HURRICANE SANDY, APPROACHING THE COLD FRONT To highlight the impending confrontation between Hurricane Sandy and the cold front, I layered GOES 13 satellite imagery over simple physical geography. The surface-pressure lines give it critical context. 2014. Superstorm |
|
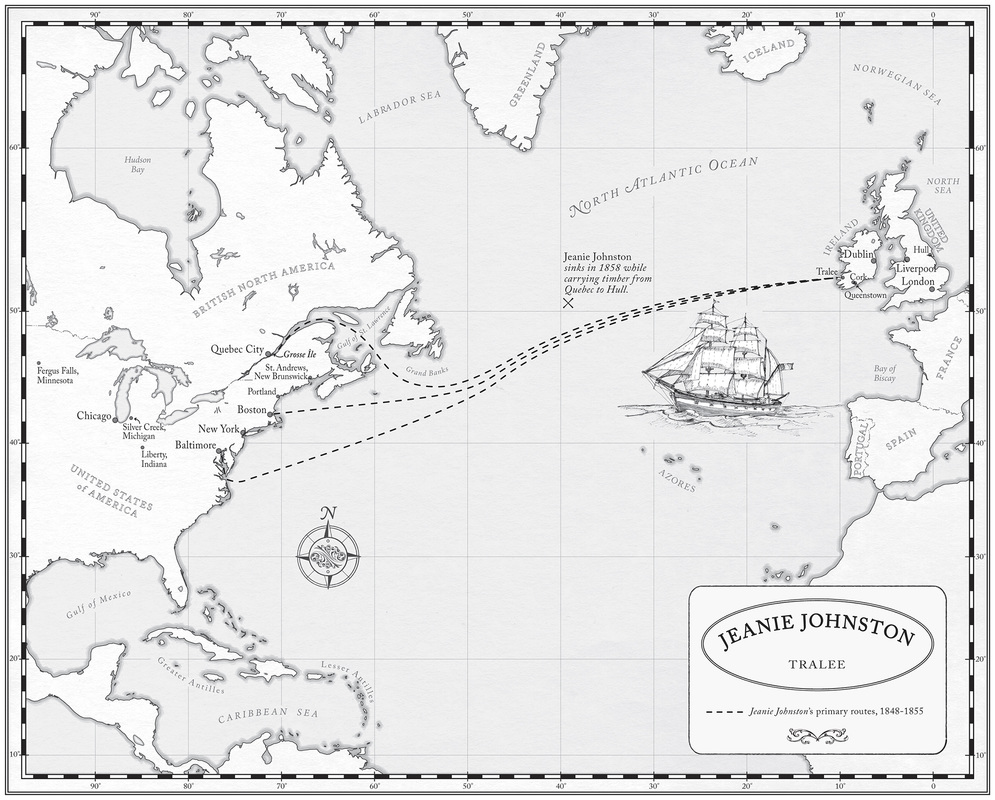
JEANIE JOHNSTON, TRALEE The look of 18th-century charts and the imagery of Kathryn Mile's book All Standing became the style guide for this project. 2013. All Standing |

|

|
|
|
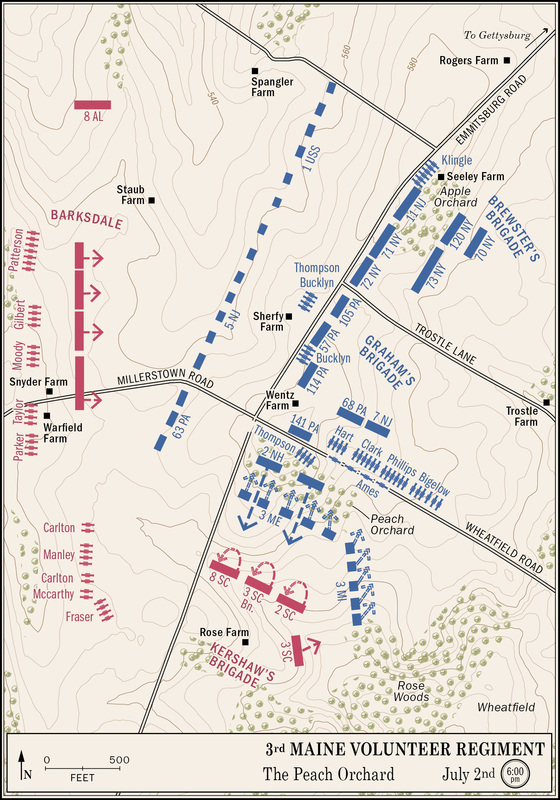
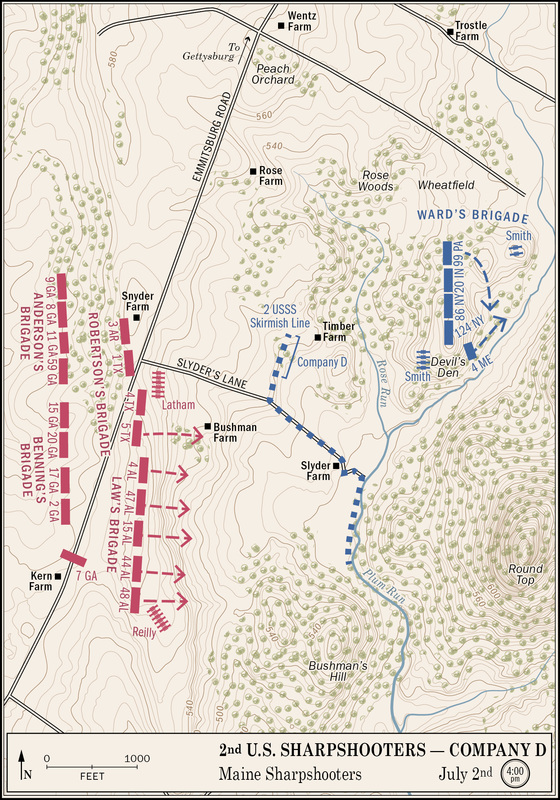
4 MAPS FROM TURNING THE TIDE IN GETTYSBURG
This 17-map series capitalizes on the clear, legible style seen in the maps created just after the Civil War. 2014.
Turning the Tide at Gettysburg
This 17-map series capitalizes on the clear, legible style seen in the maps created just after the Civil War. 2014.
Turning the Tide at Gettysburg
|
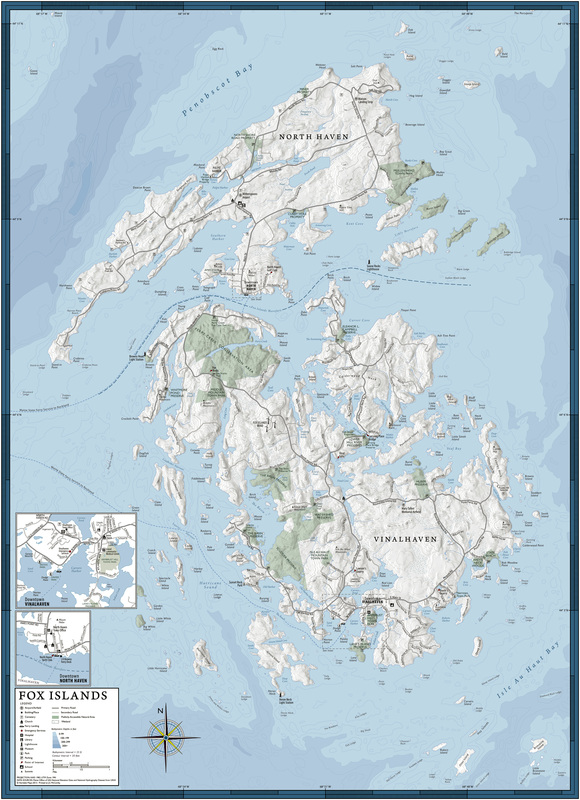
FOX ISLANDS
The Vinalhaven Chamber of Commerce contracted Hartdale Maps to update their brochure with a new format and map, and to create this related display map to sell. 2011. Vinalhaven Chamber of Commerce |
|
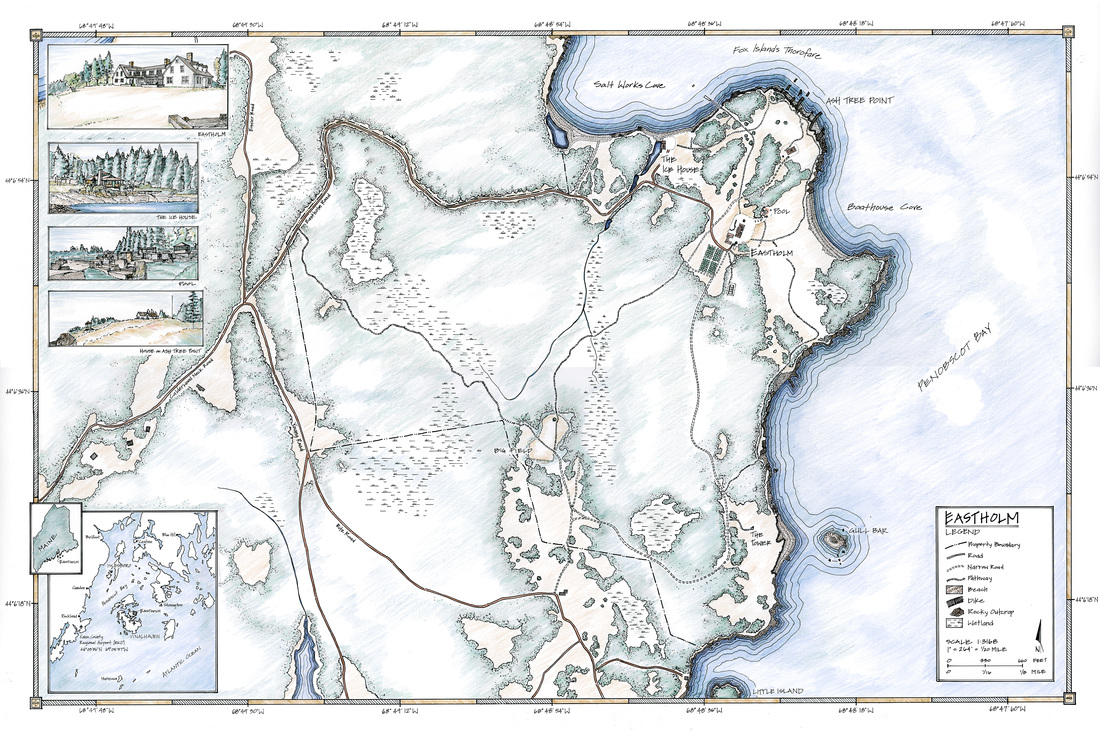
EASTHOLM. 2012.
|
|
|
|
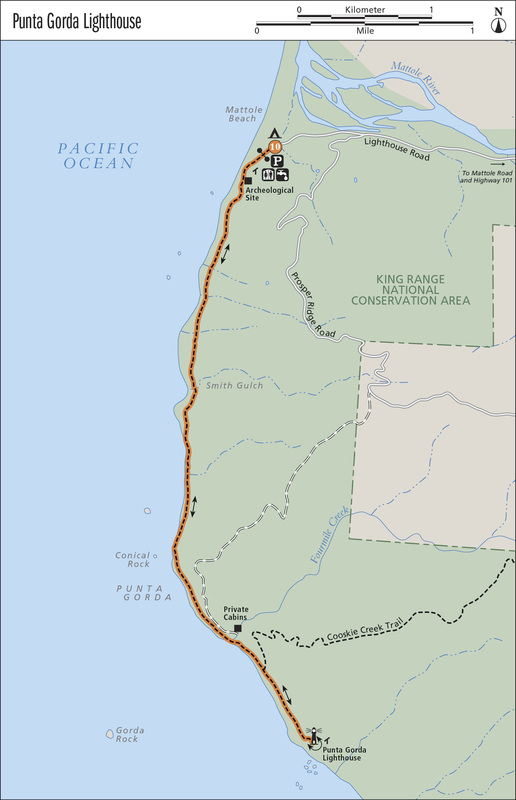
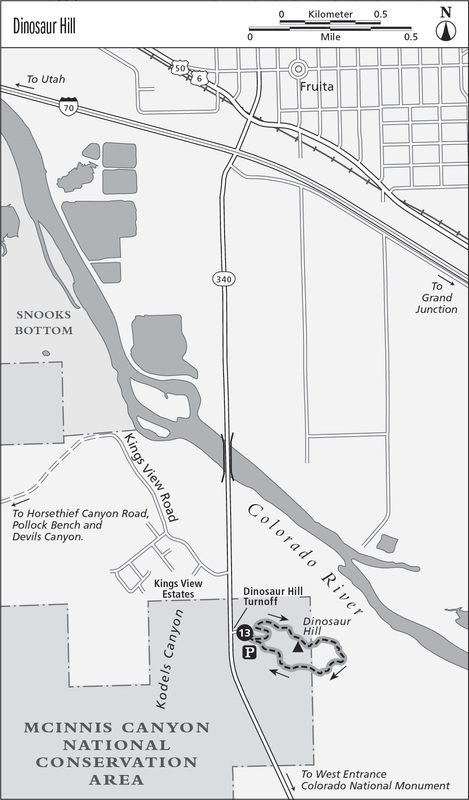
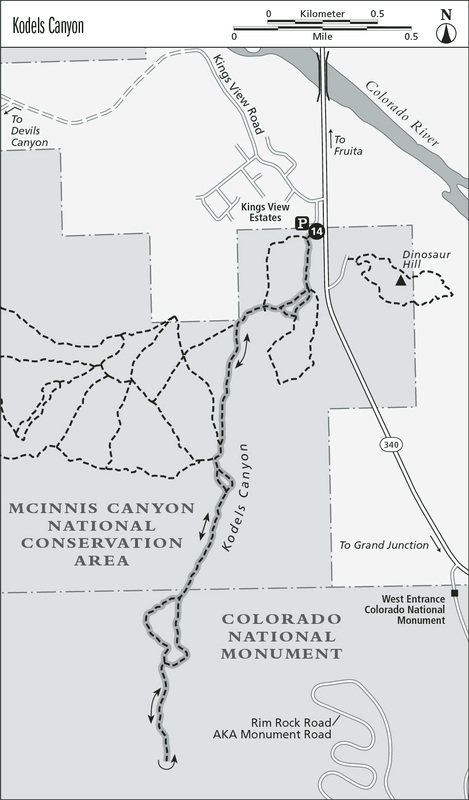
FALCON GUIDES MAPS
These maps represent the style of the hundreds of maps that Hartdale Maps has done for Globe Pequot Press' Falcon Guides. Clear, consistent and easy to read. 2009-.
Falcon Guides
These maps represent the style of the hundreds of maps that Hartdale Maps has done for Globe Pequot Press' Falcon Guides. Clear, consistent and easy to read. 2009-.
Falcon Guides
|
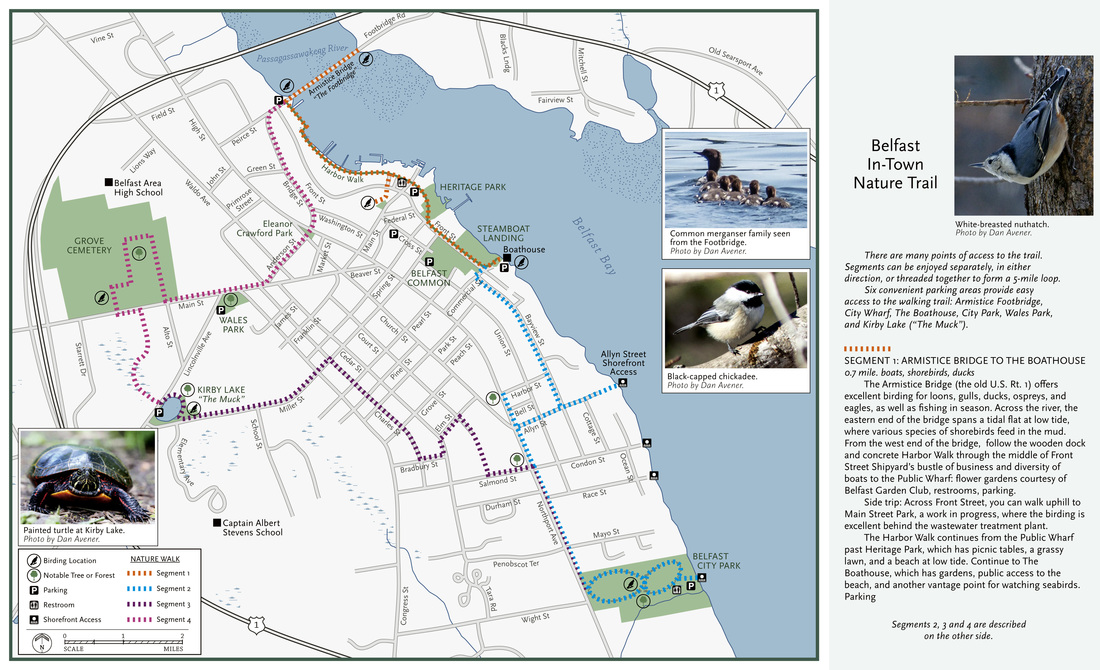
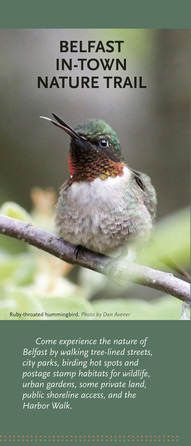
BELFAST IN-TOWN NATURE TRAIL. 2014.
|
|
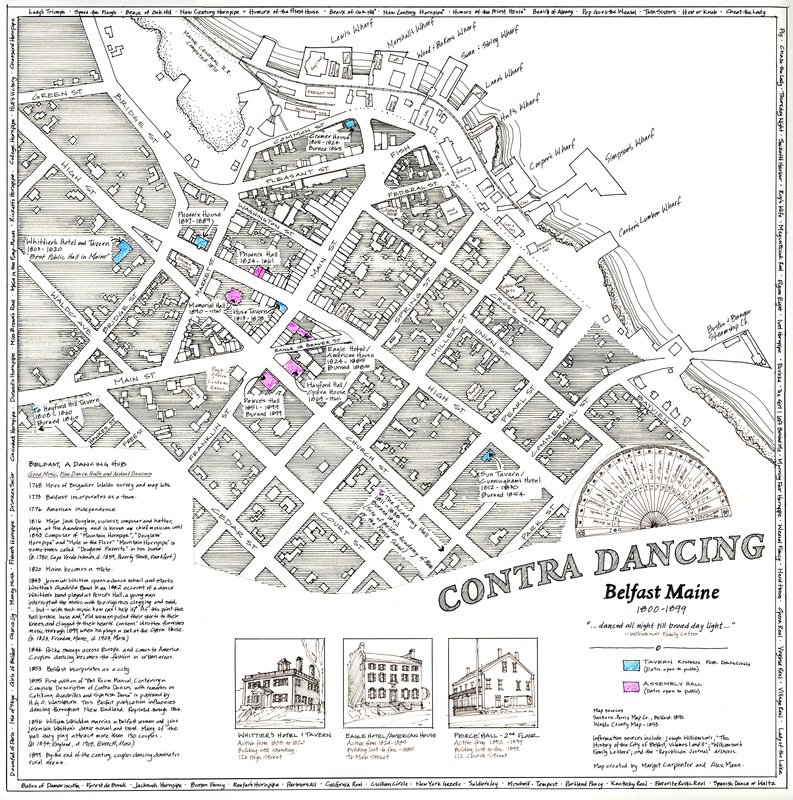
CONTRA DANCING, BELFAST, MAINE When Alex Mann asked me to create a map for his upcoming book about contra dancing, I used it as a departure point to explore Giambattista Nolli's mapping style. 2011. |
|
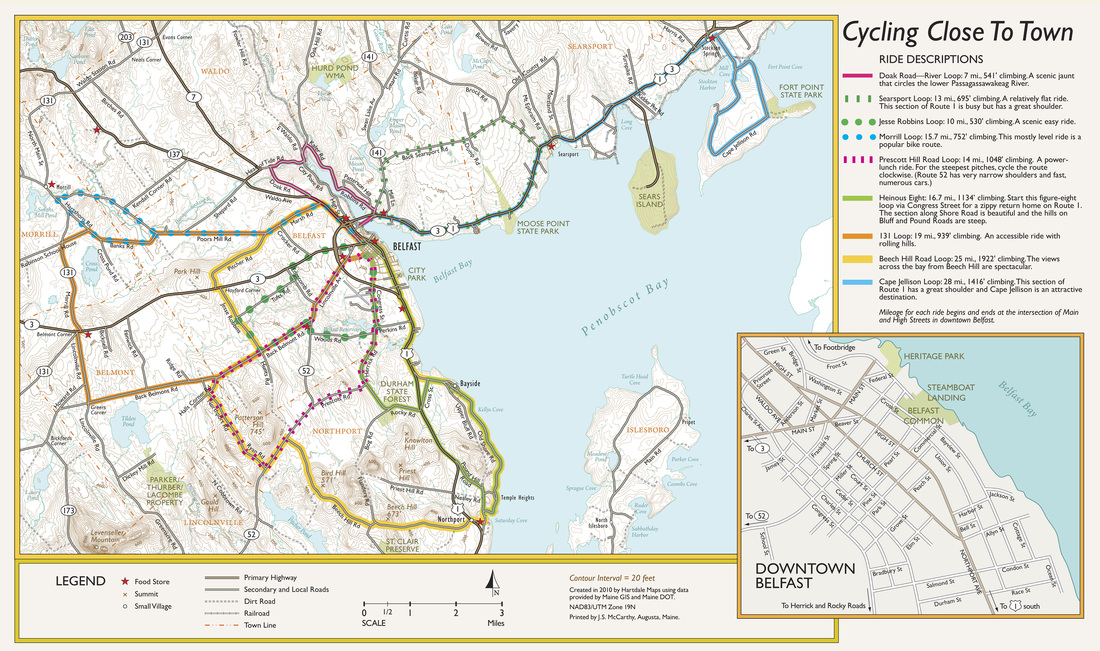
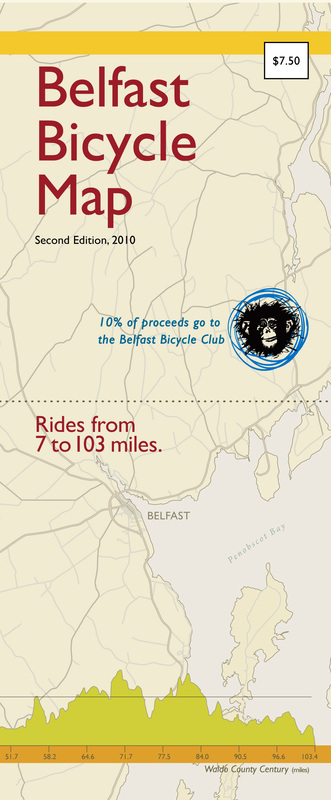
BELFAST BICYCLE MAP BROCHURE
This brochure captures the essential information a cyclist needs to plan a trip. Road surface, distance, elevation and key locations for food and water stops. 2010. |

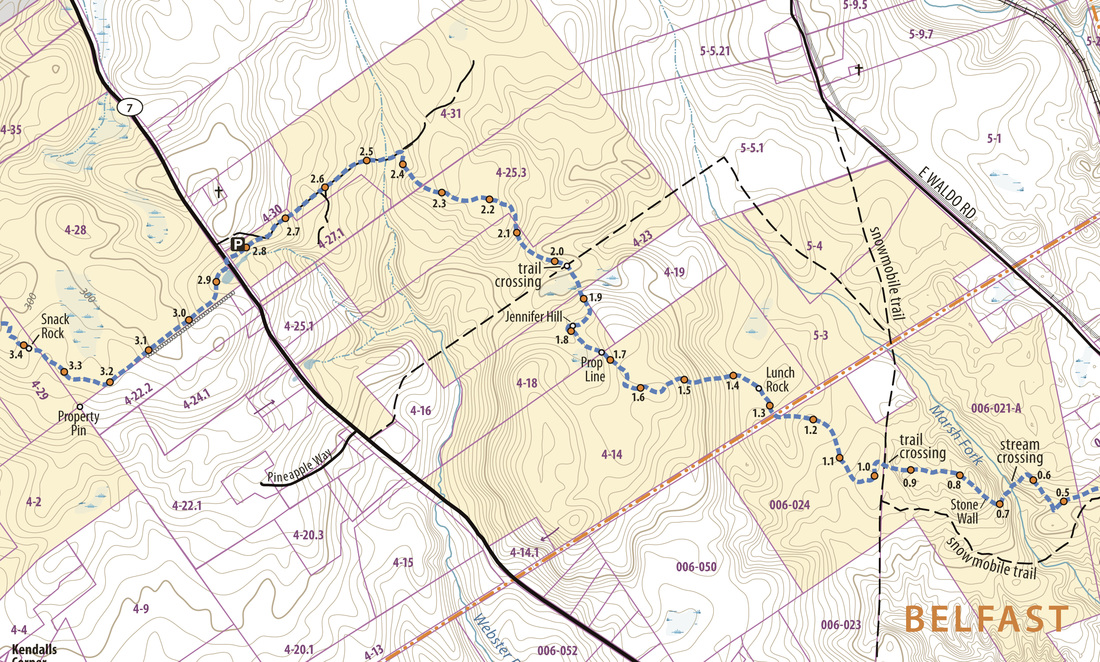
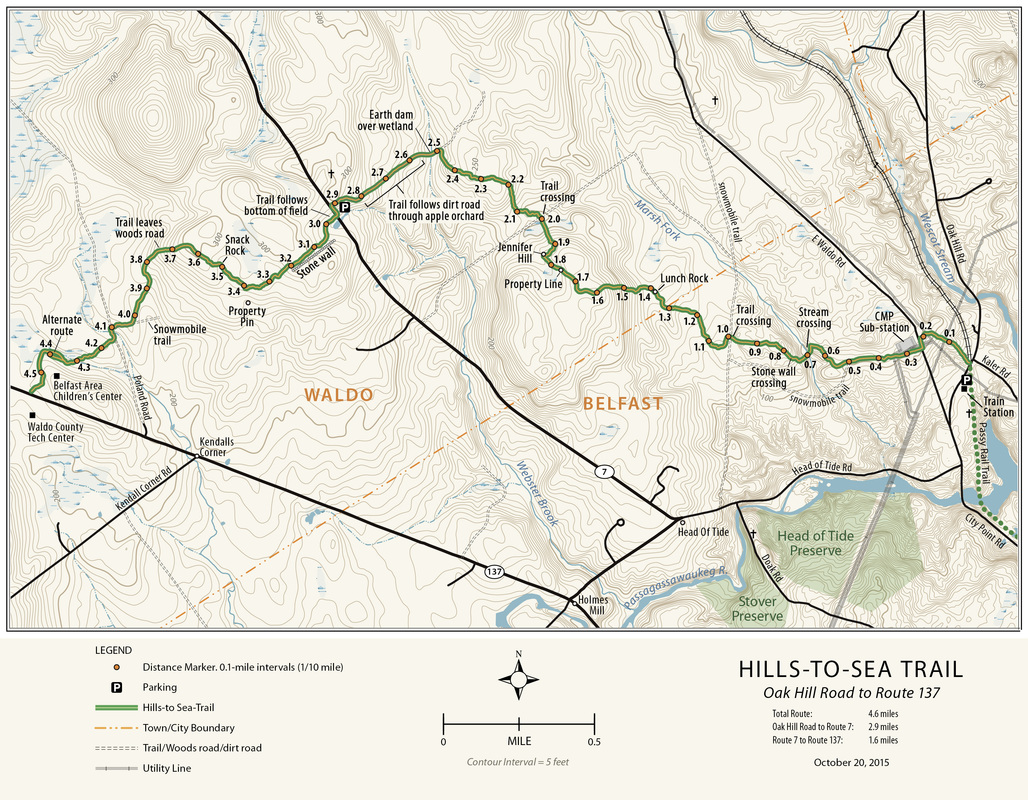
HILLS TO SEA TRAIL PROJECT
This an ongoing project with an all-volunteer group building a new recreational trail. The initial 2 study maps here are designed to help them locate potential trail routes, and the 3rd map shows the trail as built to date.
Waldo County Trails Coalition
This an ongoing project with an all-volunteer group building a new recreational trail. The initial 2 study maps here are designed to help them locate potential trail routes, and the 3rd map shows the trail as built to date.
Waldo County Trails Coalition